
This paper proposes a field-testable operating model for CTOs: one traceable evidence base that executive peers can inspect for their own jobs without relying on the CTO's persuasion. It matters because senior leaders often judge engineering by remembered incidents and impressions. The six hypotheses have not been tested.
This paper proposes a field-testable operating model for CTOs in which engineering evidence becomes a shared operating truth that executive peers can inspect for their own jobs. It matters because senior leaders often judge engineering by remembered incidents and impressions, not by evidence. The model gives six hypotheses and a 30-45 day protocol, none yet tested.
Abstract
Engineering organizations generate abundant operational data, yet senior leaders often continue to evaluate engineering through remembered incidents, individual examples, meeting impressions, and generalized confidence or concern. This paper proposes that the core problem is an executive legibility problem, not a shortage of engineering metrics: engineering evidence is rarely translated into a shared operating truth that a CEO, operations leader, product leader, sales leader, finance leader, security leader, and CTO can all use for their different jobs.
The paper develops a field-testable operating model for CTOs. The model uses one underlying evidence base, explicit historical or target baselines, a deliberate reporting order of worse → materially unchanged → better, role-specific executive lenses, a concern-to-evidence-to-root-cause-analysis (RCA) closure loop, explicit data-quality disclosures, and an AI layer that lets peers interrogate the same facts in their own language. The model is intended for execution rather than publication-only review. It therefore includes hypotheses, measurable outcomes, a 30-45 day intervention protocol, data definitions, failure modes, sample prompts, and instruments for evaluating whether executive conversations become more evidence-driven, less repetitive, and more decision-oriented.
The principal hypothesis is that engineering effectiveness becomes organizationally useful only when non-engineering executives can independently inspect it without depending on the CTO’s persuasion. The mature state is not “leadership trusts Engineering.” It is “leadership trusts the evidence system.”
Key points
- Question
-
How can engineering evidence become something a CEO, operations leader, product leader, sales leader, finance leader, and security leader can each inspect for their own job, without relying on the CTO’s persuasion?
- Proposal
-
A Shared Operating Truth system: one traceable evidence base, explicit baselines, reports that lead with what is worse, then what is unchanged, then what is better, role-specific lenses, a concern-to-closure loop, published data limits, and an AI layer that answers questions from the same facts.
- Meaning
-
Six falsifiable hypotheses and a 30-45 day field protocol are given so that peers can test the model. None has been tested yet. If they hold, executive trust moves from the CTO to the evidence system.
Status of this paper
This is a practitioner-research draft, not a claim of completed empirical validation. The framework is derived from repeated operating problems observed in executive engineering reviews and from established work on software delivery performance, developer productivity, and multidimensional management measurement. The hypotheses below are intentionally falsifiable and should be tested in live organizations.
The intended readers are CTOs and their executive peers. “CTO peers” means the leaders who sit beside the CTO in the executive system, not other CTOs.
Executive proposition
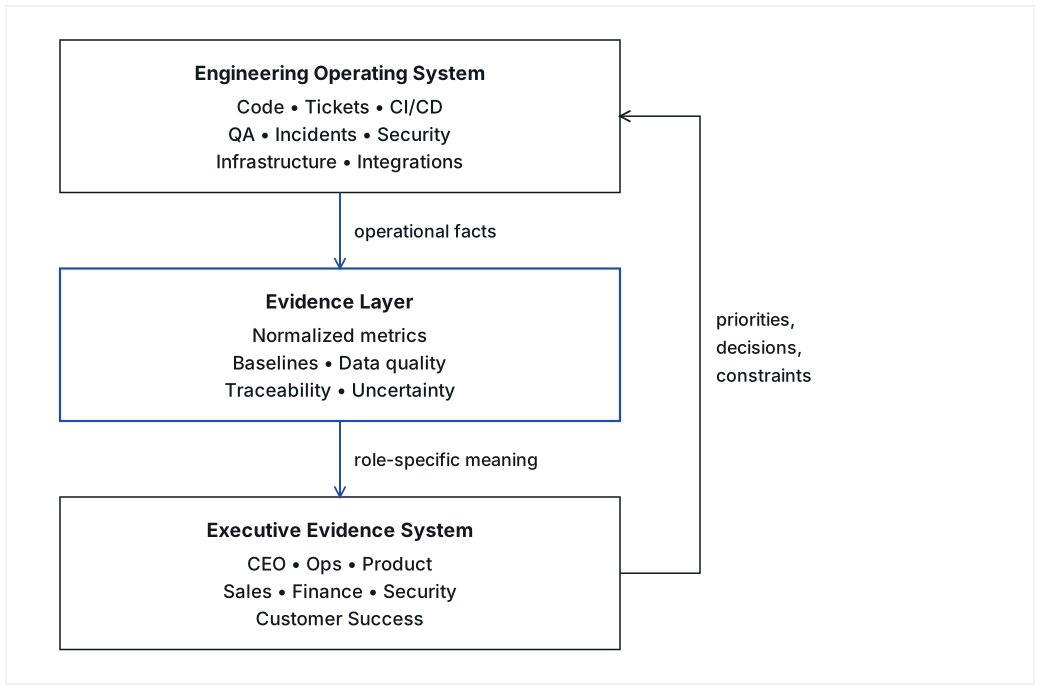
A CTO operates two systems:
-
the engineering operating system, where software is designed, built, tested, released, secured, observed, repaired, and improved; and
-
the executive evidence system, where the rest of the company decides whether Engineering is effective, trustworthy, adequately funded, underperforming, creating risk, enabling revenue, or creating work for others.
Most CTOs spend far more effort improving the first system than designing the second. The result is a predictable failure mode: Engineering may objectively improve while executive confidence remains flat or deteriorates because the improvements are not legible in terms the rest of the company uses to make decisions.
The proposed solution is a Shared Operating Truth system: one traceable evidence base, interpreted through multiple jobs-to-be-done lenses, with explicit comparisons over time and an operating mechanism for turning anecdotes into documented concerns that can be investigated and closed.
Weakened if: in organizations without a shared evidence system, executive confidence in Engineering rises with measured engineering improvement as readily as it does where such a system exists.
1. The problem: Engineering is measurable but not necessarily legible
1.1 The engineering legibility gap
The engineering legibility gap is the distance between what Engineering can measure and what executive peers need to know to perform their own jobs.
A CTO may know that deployment frequency improved, recurring defects fell, automated test coverage increased, more integrations were shipped, and the maintenance queue is under control. An operations leader may still experience Engineering as slow because individual customer requests take longer. A CEO may see increased total output but worry that headcount grew faster than throughput. A CRO may care almost entirely about integrations, security reviews, enterprise blockers, and time-to-demo. A finance leader may ask whether the organization can connect engineering spend to delivered capacity or avoided risk.
These interpretations do not contradict one another. They are different jobs applied to the same operating system.
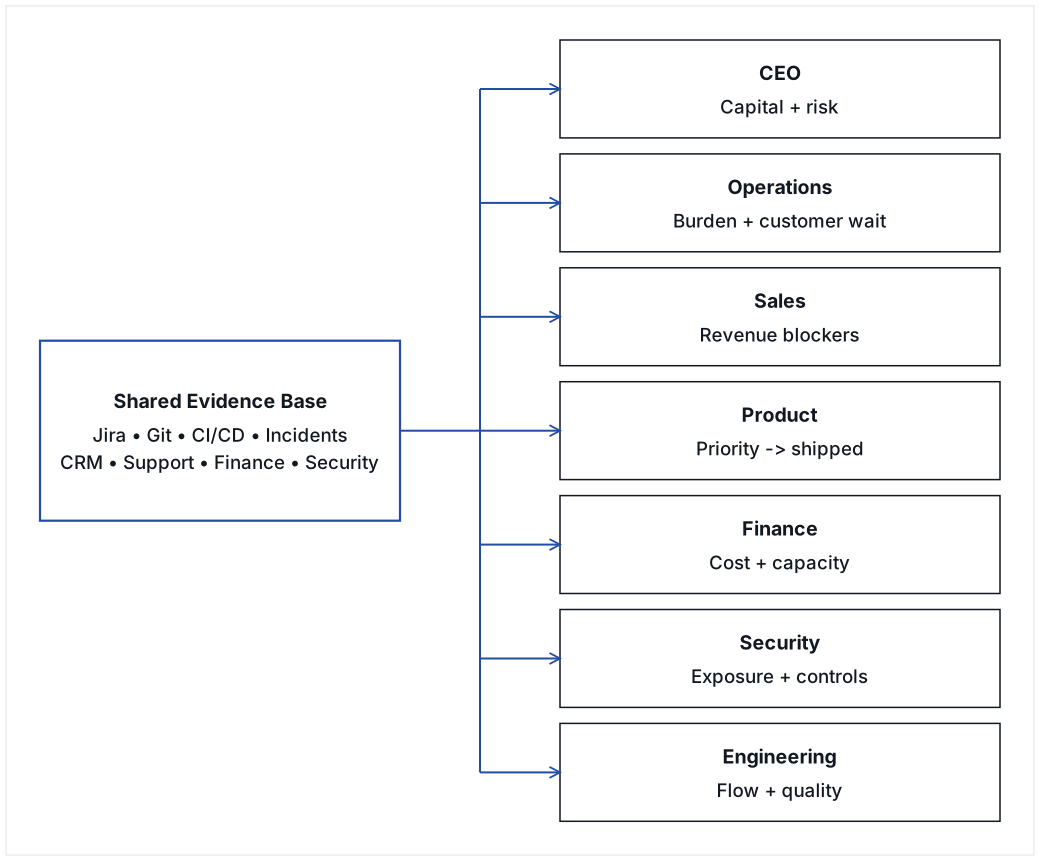
The mistake is to respond by creating different versions of reality for different executives. The better design is one evidence base with different lenses.
1.2 The anecdote trap
When no shared evidence system exists, executive conversations naturally default to memorable examples:
-
the customer escalation everyone remembers;
-
the engineer who was unprepared in a meeting;
-
the release that failed;
-
the integration that took too long;
-
the embarrassing defect;
-
the project that shipped on time;
-
the heroic recovery from an outage.
Anecdotes are valuable sensors. They are poor management units.
The operating rule proposed here is:
An anecdote may trigger investigation. It should not remain the unit of management.
A consequential anecdote should become a documented concern with evidence, ownership, root-cause analysis when appropriate, corrective action, measurable follow-up, and closure criteria.
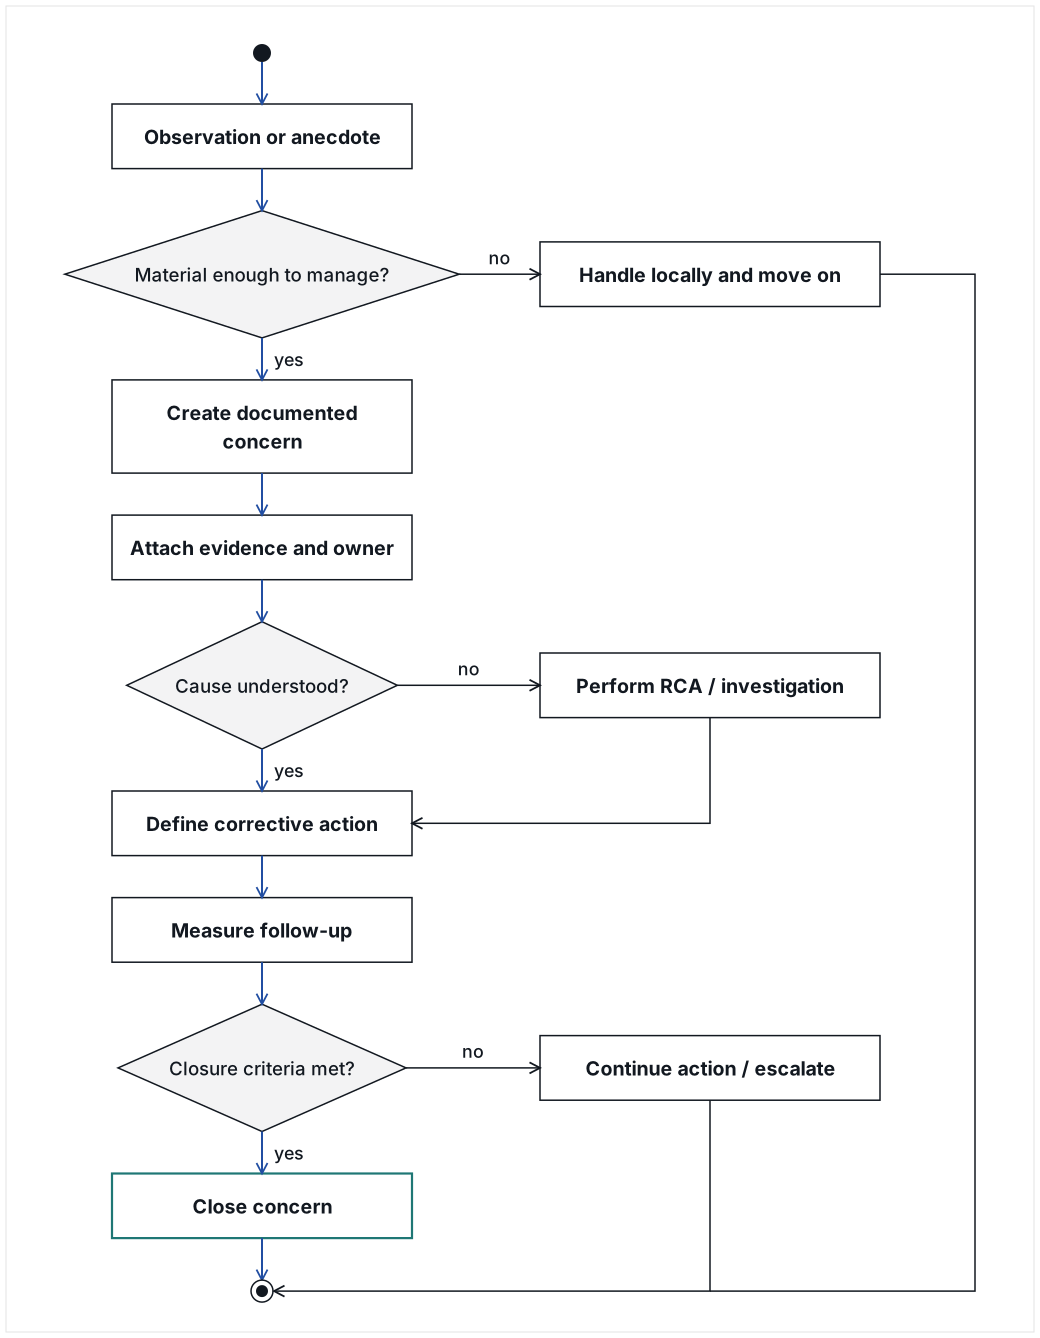
The practical effect is important. Once a concern is documented and closed, it should not be repeatedly re-litigated without new evidence. If it recurs, recurrence itself becomes new evidence.
2. Jobs to be done: what executive peers actually need from Engineering evidence
Engineering dashboards often begin with whatever Engineering already measures. The model in this paper starts instead with the decision job of the recipient.
| Role / lens | Job to be done | Questions that matter | Evidence likely to matter |
|---|---|---|---|
CEO |
Allocate capital and leadership attention |
Is additional engineering investment producing enough business value? What remains at risk? Is delivery becoming more predictable? |
Total throughput, throughput per contributor, customer risk, delivery speed, major capabilities created, revenue-enabling work, cost where available |
Operations leader |
Reduce operational burden and customer friction |
Is Engineering making Operations easier or harder? What creates repeat work? How long do customers wait? |
Maintenance aging, cycle time, open queue, repeat defects, incidents, escaped defects, integration delays, release cadence |
Sales / CRO |
Convert demand into revenue without avoidable technical blockers |
What is delaying deals, demos, integrations, enterprise reviews, or go-live? |
Integration throughput, security questionnaires, enterprise blockers, sales engineering demand, time-to-demo, voice-of-customer (VOC) delivery |
Customer Success / Account Management |
Protect retention and expansion |
Which engineering issues are affecting important customers? Are they recurring? How long have they been open? |
Customer-linked incidents, aging, repeat defects, escalation frequency, affected accounts, renewal or expansion blockers |
Product |
Convert strategy and customer demand into shipped capability |
Are priorities, VOC, and product commitments moving through the system predictably? |
Enhancement cycle time, backlog age, VOC throughput, release cadence, capacity allocation, blocked work |
Implementation / Onboarding |
Get customers operational quickly |
What is the real elapsed time to go live, and which part is controlled by Engineering versus vendors or customers? |
Onboarding cycle time, integration stages, phone setup, dependencies, vendor wait, certification wait |
Security / Compliance |
Reduce material technical risk and demonstrate control operation |
What exposure remains? How severe is it? Is remediation timely? Are controls actually operating? |
Findings by severity, age, remediation time, recurring findings, access reviews, audit evidence, incident response exercises |
Finance |
Understand return on engineering spend |
What capacity and risk reduction are we buying? Where is cost rising faster than outcomes? |
Payroll and contractor cost, output, release and integration throughput, support burden, cloud cost, cost per outcome where valid |
Engineering |
Improve the delivery system |
Are we becoming faster, higher quality, more reliable, and easier to operate? |
DORA-style delivery measures, cycle time, escaped defects, rework, WIP, backlog, automation, observability, technical constraints |
The key rule is:
Same evidence + different job-to-be-done = different prioritization, not different facts.
Weakened if: H3’s practical test finds that executives given role-specific lenses use the evidence, get questions answered, and settle metric disputes no better than executives given a generic Engineering dashboard.
3. Research propositions and falsifiable hypotheses
The framework should be treated as a set of propositions to test rather than doctrine to adopt on faith.
H1. Worse-first reporting increases perceived credibility
If an engineering effectiveness report presents worse → unchanged → better, executive readers will rate it as more candid and less promotional than a report that presents achievements first, even when the underlying facts are identical.
Practical test: Randomize executive readers to two otherwise identical summaries, one achievement-first and one worse-first. Measure perceived honesty, confidence in the author, likelihood of requesting additional validation, and recall of unfavorable findings.
H2. Explicit baselines reduce anecdotal re-litigation
If engineering performance is repeatedly shown against a clearly defined baseline era or target state, executive conversations will contain fewer unsupported claims that “things used to be better” or “things are worse now.”
Practical test: Code executive meeting notes for historical claims before and after the intervention. Measure how often those claims are linked to evidence.
H3. Role-specific lenses increase adoption without fragmenting truth
If each executive receives a lens tailored to their job but derived from the same data model, dashboard use and cross-functional agreement will increase relative to a single Engineering-centric dashboard.
Practical test: Compare dashboard usage, questions answered, and metric disputes across role-specific versus generic views.
H4. Publishing data limitations increases trust
Reports that explicitly identify missing data, proxy measures, non-comparable periods, and uncertain causal explanations will receive higher credibility ratings than reports that silently omit those limitations.
Practical test: Use paired versions of the same report with and without a “what this data cannot show” section.
H5. A documented concern-to-closure loop reduces repeated anecdotal management
When significant complaints are converted into a concern record with evidence, ownership, RCA where needed, action, and closure criteria, repeated discussion of the same issue will decline unless new evidence appears.
Practical test: Track recurrence of previously discussed issues in executive meetings and whether recurrence is accompanied by new evidence.
H6. Queryable evidence reduces reporting latency
When executives can query an AI interface grounded in the same traceable evidence model, time spent preparing ad hoc engineering status reports and time-to-answer executive questions will decline.
Practical test: Compare hours spent on report preparation and median response time for executive questions before and after deployment.
4. The baseline problem: “better than what?”
A current-state number without a comparison is rarely sufficient for an executive decision.
“Six releases this month” may be excellent, normal, or poor. “Ninety-four open tickets” may represent improvement or deterioration. “Four incidents” may be unacceptable or materially better than history.
A useful engineering evidence system therefore defines a comparison model before it defines a dashboard.
4.1 Baseline choices
Common baselines include:
-
prior leadership era;
-
previous calendar or fiscal year;
-
previous quarter;
-
pre-intervention period;
-
explicit service-level target;
-
customer cohort baseline;
-
industry benchmark, used cautiously;
-
internally agreed “good” state.
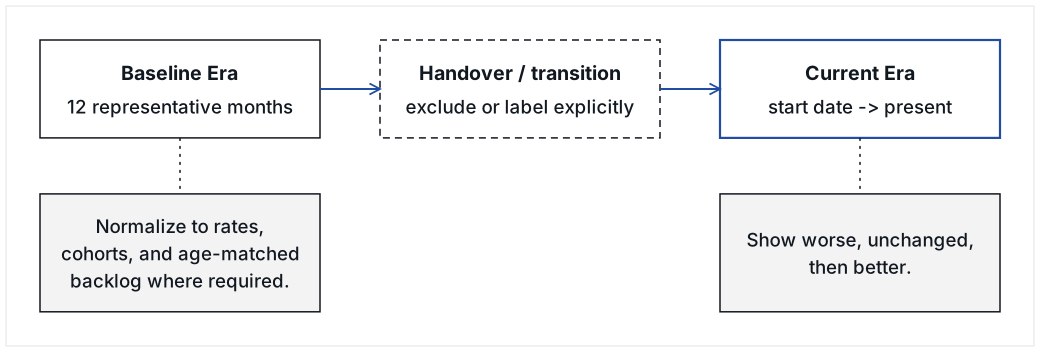
A leadership transition creates an unusually useful natural baseline: the last full or representative period before the transition compared with the new operating era. The goal is not to prove that one leader is better than another. The goal is to stop relying on institutional memory as the comparison mechanism.
4.2 Normalize unequal eras
If periods differ in length, raw totals should not be compared without adjustment. Depending on the metric, use:
-
per-month or per-week rates;
-
percentages rather than counts;
-
customer-normalized rates;
-
age-matched backlog snapshots;
-
medians rather than means for skewed cycle-time distributions;
-
cohort analysis;
-
headcount-normalized measures, with strong caveats;
-
separate controllable and externally constrained elapsed time.
4.3 Do not hide inconvenient baseline sensitivity
If a conclusion changes when a reasonable baseline definition changes, the report should say so. For example, if including a historical intake queue changes throughput from “better” to “unchanged,” that sensitivity is itself decision-relevant evidence.
A conclusion that depends on the baseline is not a weakness in the report; it signals that the data model is being treated honestly.
Weakened if: H2’s practical test shows that meetings held against a defined baseline contain as many unsupported historical claims as meetings without one.
5. Activity is not outcome
Engineering work is easy to count and difficult to value. A CTO should separate activity measures from outcome measures whenever possible.
| Area | Activity statement | Outcome statement |
|---|---|---|
Tickets |
“We closed 200 tickets.” |
“The open maintenance queue fell from 47 to 10 while incoming demand increased.” |
Releases |
“We deployed six times.” |
“Customer fixes now reach production weekly and release variance narrowed.” |
Testing |
“We automated 300 tests.” |
“Escaped defect rate fell, repeat defects fell, or neither changed despite more automation.” |
Security |
“We opened 49 findings.” |
“Critical and High exposure fell to X, median remediation time changed to Y, and recurrence is Z.” |
Headcount |
“We added seven engineers.” |
“Total throughput increased X%, parallel integration capacity increased Y, while output per contributor changed Z.” |
Infrastructure |
“We added monitoring.” |
“Detection time, recovery time, false alarms, or customer-impacting incidents changed by X.” |
A useful rule is:
Never present an activity metric without stating the outcome it is intended to influence.
If the intended outcome cannot yet be measured, say so and make the missing measurement part of the data backlog.
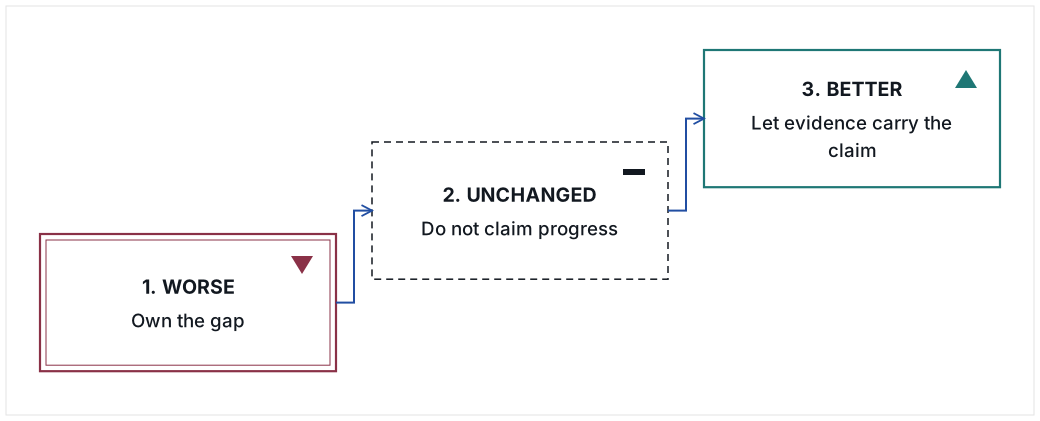
6. The credibility sequence: worse → unchanged → better
Most engineering reporting is achievement-first. That is understandable and often counterproductive.
The author of an engineering report has an obvious incentive to make Engineering look effective. Executive readers know this. Achievement-first reporting therefore starts with a credibility tax.
The proposed ordering deliberately reverses the normal instinct:
-
What is worse?
-
What is materially unchanged?
-
What is better?
This sequence is an information-integrity mechanism, not pessimism.
A related writing rule applies to “bad but improving” metrics:
- Incorrect emphasis
-
“Cycle time improved substantially this quarter, although it remains above last year.”
- Preferred emphasis
-
“Cycle time remains worse than last year; however, it has improved since the prior quarter.”
The difference is small linguistically and large politically. The second sentence tells the reader the report is not trying to reverse the priority of the evidence.
Weakened if: H1’s practical test shows executive readers rate a worse-first report no more candid, and no less promotional, than an identical achievement-first report.
7. Headcount: the contradiction a CTO should not explain away
One of the most difficult executive questions is also one of the most legitimate:
We added people. What did we get for them?
A larger team can simultaneously:
-
produce more total work;
-
produce less work per contributor;
-
support more parallel programs;
-
establish new capabilities that did not previously exist;
-
absorb more incoming demand;
-
improve resilience and security;
-
incur onboarding and coordination costs;
-
remain economically disappointing.
All of these statements can be true at the same time.
A trustworthy CTO report surfaces the contradiction instead of choosing the favorable side.
7.1 A minimum headcount evidence set
At minimum, show:
-
active contributors by period;
-
total delivered work by period;
-
throughput per contributor, labeled as a rough capacity ratio rather than an individual productivity score;
-
demand volume;
-
new capabilities created;
-
parallel work capacity;
-
cycle time;
-
defect outcomes;
-
customer-impacting outcomes;
-
cost, once reliable financial data is available.
7.2 Avoid individual productivity misuse
Team-level output-per-contributor ratios can expose a capacity question. They should not be used to rank individual engineers. Software productivity is multidimensional, collaborative, and sensitive to work type. The SPACE framework explicitly argues against reducing developer productivity to a single dimension.[3] The purpose here is executive capacity analysis, not employee surveillance.
Weakened if: executive readers rate a report that states the headcount contradiction as no more credible than an otherwise identical report that presents only the favorable side.
8. Dependencies: separate controlled time from elapsed time
Complex B2B engineering frequently depends on external actors: cloud vendors, EHRs, payment platforms, customers, certification bodies, app marketplaces, security reviewers, data providers, or implementation partners.
A weak executive explanation says:
The vendor delayed us.
A stronger evidence model decomposes elapsed time:
Even if precise time accounting is initially unavailable, the workflow should explicitly distinguish these states.
This improves both fairness and accountability. Engineering cannot be held responsible for vendor approval time, but it can be held responsible for failing to escalate, failing to complete its portion promptly, or failing to establish a commercial relationship that could reduce external wait.
Weakened if: teams that split elapsed time into engineering, internal, customer, vendor, and certification components are judged no more fairly, and escalate no more promptly, than teams that report one elapsed time.
9. Quality: measure the outcome, not merely the quality program
Quality programs create their own measurement traps.
More automated tests do not prove quality improved.
More defects found by QA can mean QA improved, code quality worsened, or both.
More security findings can mean exposure increased, visibility improved, or both.
A balanced quality model should distinguish:
-
defects introduced;
-
defects detected before production;
-
defects escaping to production;
-
recurring defects;
-
customer-impacting incidents;
-
severity;
-
time to restore;
-
time to remediate;
-
defect and incident rates normalized to demand where appropriate.
The same principle applies to security. Finding more vulnerabilities after introducing better scanning is not automatically bad news. Failing to remediate them is a different issue. The report should preserve that distinction.
Weakened if: in a team’s own history, counts of automated tests or QA-found defects track escaped-defect rate and customer-impacting incidents so closely that the outcome measures add no information.
10. Customer consequence: connect Engineering to the outside world
Engineering effectiveness becomes more meaningful when connected to customer outcomes.
Useful measures may include:
-
customer-impacting incidents;
-
customers affected per incident;
-
time to restore service;
-
customer-linked defect aging;
-
support contacts generated;
-
escalation frequency;
-
implementation delays;
-
integration completion;
-
time-to-go-live;
-
renewal or expansion blockers;
-
VOC delivered;
-
customer satisfaction or response-time data from support systems.
Do not infer customer satisfaction from Jira if a support or CRM system can answer the question directly.
This is why the evidence architecture should eventually cross functional boundaries.
11. Data integrity: publish the weaknesses of the evidence system
The dashboard should expose not only what is known, but what is not known.
A “what this report cannot show yet” section is a feature, not an embarrassment.
Common limitations include:
-
missing historical headcount;
-
inconsistent severity labels;
-
intake systems that changed between eras;
-
hours logged by contractors but not employees;
-
story points introduced only recently;
-
customer identifiers that changed;
-
incomplete incident timestamps;
-
cost data not yet integrated;
-
satisfaction data held outside Engineering;
-
proxies that are reasonable but imperfect.
A useful principle is:
Missing evidence should appear as a finding, not disappear from the report.
This creates a second backlog: the evidence-system backlog. Each missing source can be prioritized according to how much executive uncertainty it would remove.
Weakened if: H4’s practical test shows that paired reports with a “what this data cannot show” section receive credibility ratings no higher than the same reports without it.
12. Causal humility: say what the data shows, not what the CTO wishes it proved
Executive engineering reports often become less credible when they over-explain unfavorable results.
Preferred language includes:
-
“The data shows…”
-
“The result is concentrated in…”
-
“The available evidence is consistent with…”
-
“We cannot determine from the current data how much each factor contributed.”
-
“This remains a hypothesis until we add vendor-wait timestamps.”
Avoid causal statements that cannot be observed directly.
For example, if cycle time increased while a new team was onboarding, integrations were waiting on vendors, and security work expanded, those facts may all be relevant. Unless the data allows attribution, the report should not assign percentages or declare one cause responsible.
This discipline matters because executives often trust an analyst who admits uncertainty more than an advocate who explains everything.
Weakened if: executives rate a report that states its causal uncertainty as no more credible than an otherwise identical report that attributes the result to a single cause.
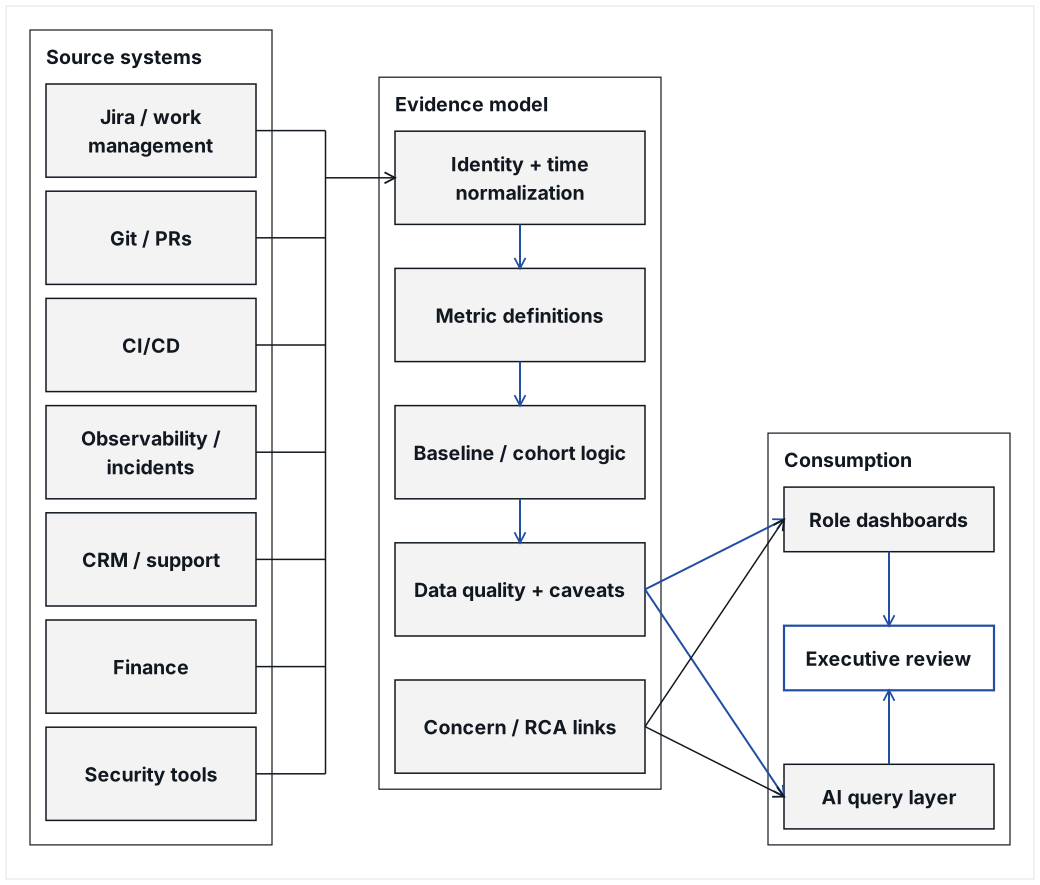
13. From dashboard to Shared Operating Truth
A dashboard is usually a set of charts. A Shared Operating Truth system is more demanding.
It should provide:
-
common definitions;
-
traceable source data;
-
comparison eras or targets;
-
explicit limitations;
-
role-specific views;
-
drill-down from claim to evidence;
-
concern and RCA linkage;
-
a query layer for questions that were not anticipated when the dashboard was designed.
The desired end state is that the CTO is no longer required to narrate every conclusion.
14. AI as a translation layer, not an advocacy engine
AI is particularly useful because the executive questions are not known in advance.
A well-designed AI layer can:
-
query raw evidence;
-
normalize time periods;
-
generate role-specific summaries;
-
surface contradictions;
-
identify missing evidence;
-
explain why a metric matters to a particular role;
-
trace a statement back to tickets, incidents, releases, or other source records;
-
generate follow-up analysis without requiring a new slide deck.
AI should not:
-
invent explanations;
-
suppress unfavorable metrics;
-
redefine measures to create a better result;
-
create different facts for different audiences;
-
present correlation as causation;
-
become an automated Engineering public-relations function.
The governing prompt should contain a rule similar to:
Use one underlying evidence set. Change only which metrics are prioritized, which questions are answered, and why those metrics matter to the role. Never change the facts for the audience.
Weakened if: H6’s practical test shows no decline in report-preparation hours or median time-to-answer once executives have a traceable AI query layer, or its answers cannot be traced to source records.
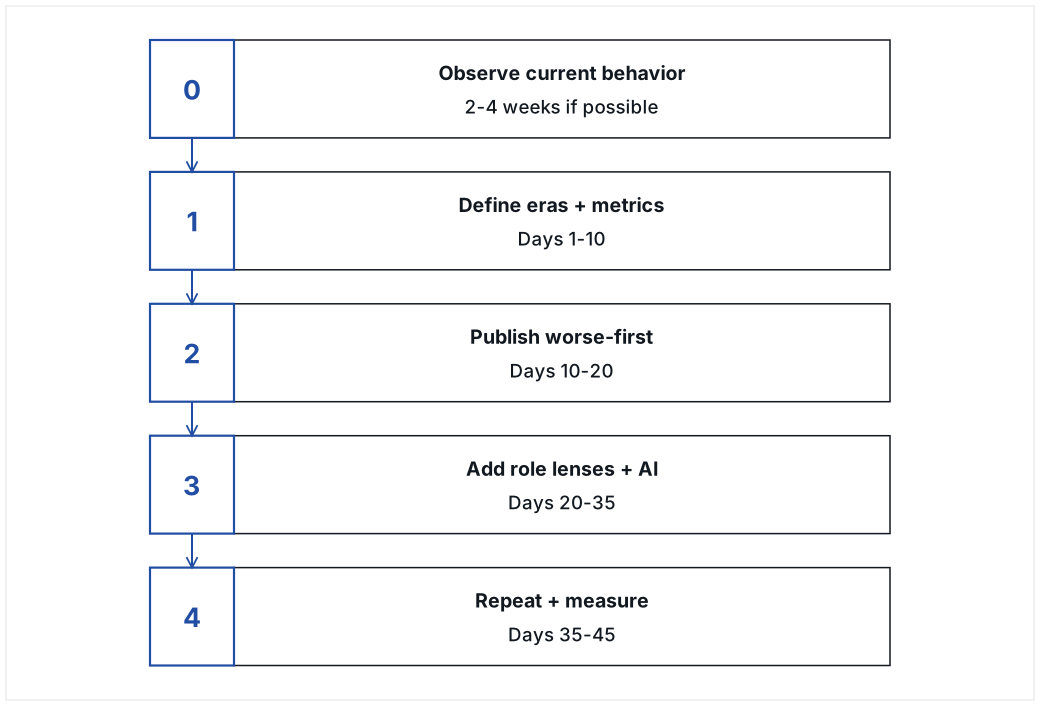
15. A field-testable intervention: the 30-45 day protocol
The framework should be tested as an intervention, not merely adopted as a reporting preference.
15.1 Phase 0: Baseline observation, 2-4 weeks if available
Before changing the reporting system, capture:
-
existing engineering review decks;
-
meeting agendas and minutes;
-
executive questions;
-
recurring complaints;
-
time spent preparing status reports;
-
time required to answer ad hoc questions;
-
number of metrics disputed in meetings;
-
examples of historical claims not tied to evidence;
-
current executive confidence ratings.
Historical meeting notes can be coded retrospectively if necessary.
15.2 Phase 1: Establish the evidence model, days 1-10
Define:
-
baseline era;
-
current era;
-
metric dictionary;
-
exclusions;
-
normalization rules;
-
worse / unchanged / better thresholds;
-
data sources;
-
known gaps;
-
role lenses.
Do not optimize appearance before definitions are stable.
15.3 Phase 2: Publish the uncomfortable version, days 10-20
Produce a narrative and scorecard that deliberately lead with unfavorable evidence.
Ask each executive:
-
What did we get wrong?
-
What is missing?
-
Which metrics do you not trust?
-
What definition would you change?
-
What decision do you need this system to help you make?
The purpose is co-ownership of the evidence system, not approval of Engineering.
15.4 Phase 3: Add role lenses and queryability, days 20-35
Add views for the highest-value executive roles. Connect additional data sources only where they answer unresolved questions.
Begin measuring self-service questions and report-preparation time.
15.5 Phase 4: Repeat until the comparison becomes boring, days 35-45
For a transition or credibility repair, repeat the same baseline comparison long enough for the shared mental model to stabilize.
Once leaders no longer debate the historical comparison, move from:
“previous era versus current era”
to:
“current target versus actual trajectory.”
16. Outcome measures for the experiment
The intervention should be judged on more than whether executives “like the dashboard.”
16.1 Evidence Coverage Ratio (ECR)
Percentage of substantive executive questions that can be answered with traceable evidence within the review period.
16.2 Anecdote Repetition Rate (ARR)
Number of previously discussed anecdotes reintroduced in executive reviews without new evidence.
Goal: decline after concerns are documented and closed.
16.3 Metric Dispute Rate (MDR)
Number of disputes about definitions, time periods, exclusions, or source data per executive review.
A temporary increase is expected during implementation. A sustained decline indicates the evidence model is becoming shared.
16.4 Decision Latency (DL)
Median elapsed time from a material engineering concern being raised to an explicit decision, assigned action, or accepted disposition.
16.5 Closure Persistence (CP)
Percentage of closed concerns that remain closed for 30 days absent new evidence.
16.6 Executive Evidence Trust (EET)
A short repeated survey, 1-5 scale:
-
I understand what Engineering is doing worse than the comparison period.
-
I understand what is materially unchanged.
-
I understand what has improved.
-
I can trace important claims to evidence.
-
I believe important negative information is unlikely to be hidden from this report.
-
I can use this information to make decisions in my role.
The point is not to maximize “confidence in Engineering.” The point is to increase confidence in the evidence.
16.7 Reporting Effort (RE)
Hours per week spent by the CTO and engineering leaders manually creating status explanations, slide decks, and one-off answers.
16.8 Query Answer Latency (QAL)
Median time from an executive question to a traceable answer.
17. Study designs peers can actually run
17.1 Within-company before/after study
The simplest design:
-
observe 2-4 weeks of existing review behavior;
-
introduce the Shared Operating Truth model;
-
measure the next 30-45 days;
-
compare ECR, ARR, MDR, DL, EET, RE, and QAL.
Threats to validity include concurrent engineering improvement, leadership changes, seasonality, and novelty effects.
17.2 Randomized communication-order test
To test H1 specifically, create two summaries from identical data:
-
Version A: better → unchanged → worse;
-
Version B: worse → unchanged → better.
Randomize peer executives, board members, or senior managers to versions. Ask them to rate honesty, confidence, defensiveness, clarity, and willingness to rely on the report.
17.3 Stepped-wedge role-lens rollout
If several functions consume Engineering data, roll out role lenses sequentially:
-
Operations;
-
CEO;
-
Product;
-
Sales;
-
Finance;
-
Security.
Measure dashboard use, questions, and evidence coverage by function before and after each lens appears.
17.4 Multi-company practitioner replication
CTO peers can replicate the protocol across organizations while keeping raw data private. A shared study can collect only normalized changes in ECR, ARR, MDR, EET, and reporting effort.
This is likely more useful than attempting to compare absolute ticket counts or story points across companies.
18. Operating rules for the executive review
The dashboard will not fix a meeting that rewards anecdotes over evidence. The review itself needs rules.
Recommended rules:
-
Any executive may raise a concern.
-
A serious concern becomes a written concern record.
-
The concern states the expected standard, evidence, impact, owner, and next action.
-
RCA is required when recurrence, severity, or uncertainty justifies it.
-
Existing metrics may be challenged, but the challenge must identify the disputed definition or evidence.
-
Closed concerns are not re-litigated without new evidence.
-
The dashboard shows unfavorable results first.
-
The CTO does not get to remove a metric merely because it looks bad.
-
Other executives do not get to substitute repeated anecdotes for the agreed evidence model.
-
The purpose of the review is decision and correction, not prosecution or defense.
Weakened if: H5’s practical test shows closed issues recur in executive meetings as often without new evidence in reviews that follow these rules as in reviews that do not.
19. Failure modes
19.1 The Engineering PR dashboard
Symptoms:
-
accomplishments first;
-
bad metrics buried;
-
explanations longer than findings;
-
only Engineering-owned data;
-
every negative result attributed externally.
Countermeasure: worse-first order, explicit gaps, peer-defined lenses.
19.2 The ticket-count dashboard
Symptoms:
-
raw ticket totals dominate;
-
work types are treated as equivalent;
-
no customer, quality, or financial relationship;
-
“busy” is confused with “effective.”
Countermeasure: activity-to-outcome pairing and role-specific decision jobs.
19.3 The CTO defense brief
Symptoms:
-
comparisons are chosen to prove the new CTO is better;
-
every negative metric is immediately contextualized away;
-
named people or historical grievances dominate;
-
the document becomes political evidence.
Countermeasure: treat leadership eras as baselines, not verdicts; publish unfavorable findings before explanations.
19.4 The surveillance dashboard
Symptoms:
-
individual developer rankings;
-
commits, lines of code, or tickets used as performance scores;
-
gaming and fear increase;
-
collaboration work becomes invisible.
Countermeasure: team and system-level measures; use SPACE-style multidimensional thinking; keep people-management evidence separate from system-effectiveness evidence.
19.5 The perfect-data excuse
Symptoms:
-
no dashboard ships because every historical field is imperfect;
-
teams wait for a data warehouse project;
-
anecdotes remain the default meanwhile.
Countermeasure: publish a useful imperfect baseline with explicit caveats, then improve evidence coverage iteratively.
19.6 The causal-story machine
Symptoms:
-
AI generates plausible reasons for every metric;
-
correlations become causes;
-
vendor blame is accepted without timestamps;
-
explanations cannot be traced to evidence.
Countermeasure: causal humility and explicit “unknown” states.
Weakened if: organizations showing these symptoms apply the listed countermeasures and the symptoms do not change, or the field protocol surfaces failures that fit none of the six patterns.
20. Maturity model
| Level | Evidence state | Executive behavior | CTO burden |
|---|---|---|---|
0. Anecdotal |
Metrics fragmented or absent |
Meetings dominated by remembered events |
High explanation and defense burden |
1. Reporting |
Static engineering metrics exist |
Executives receive status but still ask separate questions |
High manual reporting burden |
2. Comparative |
Baseline and current state normalized |
Historical claims increasingly tested against data |
Moderate reporting burden |
3. Shared Operating Truth |
One evidence model, explicit gaps, role lenses |
Executives debate definitions and decisions rather than memories |
Lower explanation burden |
4. Queryable |
Cross-functional data plus traceable AI interface |
Executives self-serve many questions and drill down |
Low ad hoc reporting burden |
5. Predictive / experimental |
Evidence tied to targets, interventions, and causal tests |
Leadership tests operating hypotheses rather than merely reviewing status |
CTO focuses on system design and decisions |
Weakened if: organizations at higher levels show no fewer anecdotal historical claims, no lower reporting burden for the CTO, or no more executive self-service than organizations at lower levels.
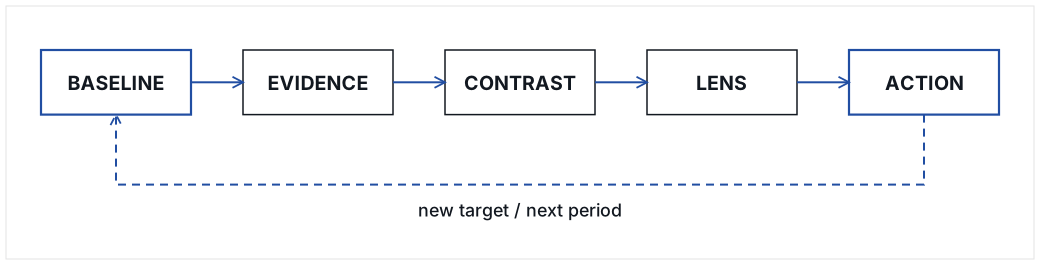
21. The BASELINE → EVIDENCE → CONTRAST → LENS → ACTION framework
The paper can be reduced to five operating moves.
- BASELINE
-
What are we comparing against?
- EVIDENCE
-
What do the source systems actually say, and how trustworthy is it?
- CONTRAST
-
What is worse, materially unchanged, and better?
- LENS
-
What does this mean for the person making a decision?
- ACTION
-
What decision, correction, experiment, or closure follows?
22. Discussion
The proposed model extends familiar engineering measurement in a specific direction: from measuring software delivery to making engineering performance useful in executive governance.
DORA-style measures are valuable because they make delivery speed and stability observable.[1][2] SPACE is valuable because it resists collapsing developer productivity into one number.[3] Balanced Scorecard thinking is relevant because executives need multiple perspectives rather than a single operational metric.[4] The gap addressed here is the translation mechanism between engineering evidence and executive decision jobs.
The key move is to change the governance relationship around the metrics, not to add more of them:
-
historical claims become baseline comparisons;
-
anecdotes become concern records;
-
activity is paired with intended outcomes;
-
unfavorable evidence leads the report;
-
role lenses change emphasis without changing facts;
-
missing data becomes visible work;
-
AI makes the evidence queryable rather than merely presentable;
-
closure rules prevent the organization from managing through repeated memory.
This model should be expected to fail in some organizations. A company may discover that leaders do not actually want shared operating truth because anecdotal flexibility serves political or organizational interests. A CTO may discover that the metrics reveal real underperformance rather than misunderstanding. An evidence model may also expose weaknesses in work tracking, customer linkage, or financial attribution that require substantial instrumentation.
Those are findings, not reasons to avoid the intervention.
23. Limitations and open questions
This draft has several important limitations.
First, the core hypotheses have not yet been validated. They come from operating practice, and the framework is designed to make testing practical.
Second, engineering work differs substantially across SaaS, infrastructure, embedded systems, regulated products, internal platforms, and professional services. Metric definitions must be adapted without abandoning the one-evidence-base principle.
Third, executive trust is partly interpersonal. A better evidence system cannot compensate indefinitely for weak leadership behavior, unclear authority, or poor executive relationships.
Fourth, historical data quality is often poor. Comparisons must therefore disclose changes in tracking systems and definitions.
Fifth, AI can accelerate analysis while increasing the risk of confident unsupported explanation. Traceability and explicit uncertainty are mandatory design requirements.
Sixth, headcount-normalized output is especially easy to misuse. It should remain a system-capacity signal, not a ranking mechanism for individual engineers.
Open research questions include:
-
Which executive roles benefit most from role-specific lenses?
-
Does worse-first ordering continue to increase trust after the novelty wears off?
-
Which measures best predict executive perception of engineering effectiveness?
-
How many metrics can an executive lens contain before comprehension declines?
-
Does self-service AI reduce conflict, or merely increase the number of questions?
-
How does the model behave when Engineering is objectively deteriorating?
-
Can concern-closure discipline reduce executive meeting time measurably?
-
Does cross-functional evidence integration change resource allocation decisions?
24. Conclusion
The CTO is not finished when Engineering becomes effective.
The CTO is finished when the organization can determine whether Engineering is effective without depending on the CTO’s persuasion.
That requires more than a dashboard. It requires a shared operating truth: explicit baselines, traceable evidence, honest contrast, role-specific meaning, and an action-and-closure discipline that prevents anecdotes from becoming permanent management artifacts.
The mature state is not one in which the CEO says, “I trust Engineering.”
It is one in which the CEO, operations leader, product leader, sales leader, finance leader, security leader, and CTO can independently interrogate the same evidence, reach compatible conclusions about what is worse, unchanged, and better, and decide what to do next.
In that state, persuasion becomes less important because the evidence system itself has become credible.
Appendix A: Appendix A. Minimal evidence dictionary
| Metric | Preferred definition | Why it matters | Common caveat |
|---|---|---|---|
Work delivered per month |
Completed work items normalized by month and stable inclusion rules |
Total capacity |
Tickets vary greatly in size and value |
Active contributors |
People resolving a minimum threshold of work in the period |
Rough capacity denominator |
Not a productivity score |
Delivered per active contributor |
Delivered work / active contributors |
Flags headcount-versus-output mismatch |
Sensitive to work mix and ticketing practices |
Median cycle time |
Median elapsed time from agreed start state to done |
Flow speed |
Blocked time may need decomposition |
Delivered within N days |
Share of work completed within an agreed window |
Predictability |
Choose N appropriate to work type |
Open backlog |
Open in-scope items at comparable period age |
Unfinished work |
Backlog hygiene can distort result |
Aged backlog share |
Share of open items older than threshold |
Staleness / neglected work |
Internal planning tickets may require separate class |
Defect escape rate |
Production defects / all detected defects |
Customer-facing quality |
Requires consistent defect classification |
Recurring-defect rate |
Defects linked to prior same-root-cause defects / defects |
Durability of fixes |
Depends on linking discipline |
Customer-impacting incidents |
Incidents with verified customer effect |
Operational risk |
Low counts require cautious interpretation |
Release frequency |
Production releases per normalized period |
Delivery cadence |
Hotfixes should be separated or disclosed |
Integration throughput |
Completed integration work or milestones per period |
Revenue / onboarding capacity |
Vendor-controlled time can dominate elapsed time |
Maintenance cycle time |
Median elapsed time for Ops/Support-originated maintenance work |
Operational burden |
Historical intake systems may differ |
VOC delivered |
Customer-requested items shipped |
Responsiveness to market / customers |
VOC definition must be stable |
Appendix B. Sample AI prompts
B.1 Evidence integrity
Using only the connected source data, define the comparison eras and show the evidence used to establish each date range. Do not guess. List any tracking-system changes that could make the eras non-comparable.For every metric, show: definition, source system, baseline value, current value, normalization method, result classification, trend, and known caveat. If a value cannot be supported, mark it unavailable rather than infer it.B.2 Worse-first executive reporting
Rewrite the executive summary in this order: WORSE first, MATERIALLY UNCHANGED second, BETTER third. If a metric is worse but improving, state that it remains worse before stating that it is improving. Do not soften negative results.B.3 Operations lens
Using the same underlying evidence, create an Operations view that answers: Is Engineering making Operations and Support easier or harder? Prioritize customer wait, maintenance burden, repeat defects, incidents, escaped defects, backlog aging, onboarding dependencies, and release cadence. Do not change any facts.B.4 CEO lens
Using the same evidence, create a CEO view that answers: Is additional Engineering investment producing sufficient business value, and what remains at risk? Lead with where added capacity has not yet returned value, then neutral outcomes, then measurable returns. Include missing cost or customer evidence explicitly.B.5 Sales lens
Using the same evidence base, create a Sales/CRO lens focused on technical blockers to revenue: integrations, enterprise requirements, security questionnaires, demo dependencies, VOC, implementation timing, and customer go-live constraints. Separate Engineering-controlled delay from vendor- or customer-controlled delay.B.6 Skeptical review
Act as a skeptical executive peer reviewing this dashboard. Identify the five conclusions most vulnerable to challenge. For each, state what evidence supports it, what evidence is missing, and what additional data source would reduce uncertainty. Do not invent counterarguments unsupported by the data.B.7 Anti-advocacy review
Review this report for advocacy language. Replace defensive, promotional, or causal wording with neutral evidence language. Preserve explanations only when the source data supports them. Flag any sentence that sounds like Engineering is explaining away a bad result.Appendix C. Executive feedback script
When presenting the first version, the CTO should ask for criticism rather than endorsement.
Suggested questions:
-
What did we get wrong?
-
What is missing?
-
Which metric do you least trust?
-
Which definition should change?
-
Which result surprises you?
-
What question do you still have to ask me manually that this evidence system should answer?
-
Which measure would most help you make a decision in your role?
-
What data source outside Engineering should be connected next?
Appendix D. 45-day rollout checklist
Days 1-5
-
Define eras.
-
Freeze initial metric definitions.
-
Inventory source systems.
-
Collect historical reports and meeting questions.
-
Identify executive roles and their jobs to be done.
Days 6-10
-
Produce first normalized scorecard.
-
Classify worse / unchanged / better.
-
Document caveats.
-
Identify missing evidence.
-
Validate surprising numbers with source owners.
Days 11-20
-
Publish the worse-first narrative and scorecard.
-
Present negative results first.
-
Collect criticism.
-
Convert material objections into concern records or metric-definition changes.
Days 21-30
-
Publish Operations, CEO, and Engineering lenses.
-
Add highest-value cross-functional data source.
-
Add AI query interface.
-
Track question-answer latency and evidence coverage.
-
Remove metrics that do not support a decision job, not metrics that merely look unfavorable.
Days 31-45
-
Repeat the same comparison.
-
Measure anecdote repetition.
-
Measure metric disputes.
-
Measure executive evidence trust.
-
Decide which historical comparison can now be retired in favor of targets and forward trajectory.
Appendix E. Suggested field-study interview guide
Interview each executive separately before and after the intervention.
Questions:
-
How do you currently decide whether Engineering is doing well?
-
Which recent events most influence your view?
-
Which Engineering numbers do you trust today?
-
Which numbers do you distrust and why?
-
What do you wish you could ask Engineering and get an immediate factual answer?
-
What Engineering problem creates the most work for your function?
-
What would convince you that a problem has actually been fixed?
-
What would make an engineering dashboard feel like advocacy rather than evidence?
-
After using the new system: what changed in how you discuss Engineering?
-
Which decisions became easier, if any?
References
[1] Google Cloud, “Use Four Keys metrics like change failure rate to measure your DevOps performance.” DORA-style measures include deployment frequency, lead time for changes, change failure rate, and time to restore service. https://cloud.google.com/blog/products/devops-sre/using-the-four-keys-to-measure-your-devops-performance
[2] Google Cloud, “Highlights from the 10th DORA report,” 2024. The DORA research program studies software delivery performance and organizational outcomes. https://cloud.google.com/blog/products/devops-sre/announcing-the-2024-dora-report
[3] Forsgren, N.; Storey, M.-A.; Maddila, C.; Zimmermann, T.; Houck, B.; Butler, J. “The SPACE of Developer Productivity: There’s more to it than you think.” ACM Queue, 2021. https://www.microsoft.com/en-us/research/publication/the-space-of-developer-productivity-theres-more-to-it-than-you-think/
[4] Kaplan, R. S.; Norton, D. P. “The Balanced Scorecard—Measures that Drive Performance.” Harvard Business Review, January-February 1992. https://hbr.org/1992/01/the-balanced-scorecard-measures-that-drive-performance-2